
This report features world capital market performance and a timeline of events for the past quarter. It begins with a global overview, then features the returns of stock and bond asset classes in the US and international markets.
Table of Contents
RW Investment Management, LLC dba R|W Investment Management (“RWIM”) is a Registered Investment Adviser. This document is solely for informational purposes. Advisory services are only offered to clients or prospective clients where RWIM and its representatives are properly licensed or exempt from licensure. Past performance is no guarantee of future returns. Investing involves risk and possible loss of principal capital. No advice may be rendered by RWIM unless a client service agreement is in place. RWIM is not a legal or tax advisor.
Quarterly Topic: Tariff Target Markets
1st QUARTER 2025
Wes Crill, PhD, Senior Client Solutions Director and Vice President, Dimensional Fund Advisors
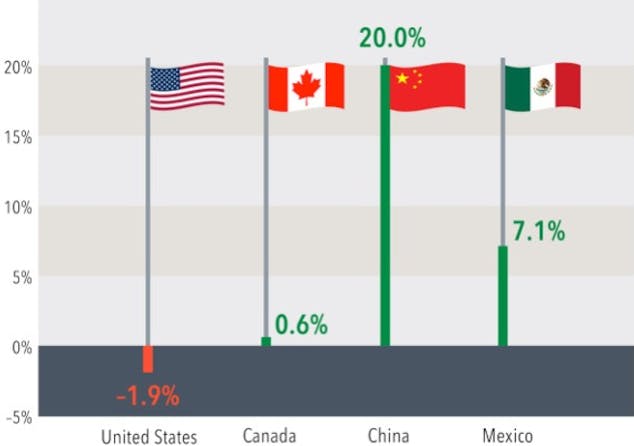
Non-US stocks have delivered a positive return thus far in 2025, helping offset the US stock market’s disappointing start to the year. But some of the sources for these positive returns may be surprising to investors.
Potential fallout from tariffs has dominated the news cycle, and yet stocks of the primary targets for tariffs—Canada, Mexico, and China—are up for the year. A short sample for sure, but this echoes outcomes during Trump’s first term in office, when the Chinese stock market outperformed the US despite contentious trade discussions throughout those four years.
The lack of negative impact on tariff-target stock markets doesn’t mean investors have tuned out trade policy discussions. Market prices incorporate the aggregate expectations of investors. It could be that tariff developments thus far were in line with those expectations and therefore already priced in by the market.
INDEX RETURNS IN LOCAL CURRENCYYear to date as of March 7, 2025
Past performance is no guarantee of future results.
Disclosures
The information in this material is intended for the recipient’s background information and use only. It is provided in good faith and without any warranty or representation as to accuracy or completeness. Information and opinions presented in this material have been obtained or derived from sources believed by Dimensional to be reliable, and Dimensional has reasonable grounds to believe that all factual information herein is true as at the date of this material. It does not constitute investment advice, a recommendation, or an offer of any services or products for sale and is not intended to provide a sufficient basis on which to make an investment decision. Before acting on any information in this document, you should consider whether it is appropriate for your particular circumstances and, if appropriate, seek professional advice. It is the responsibility of any persons wishing to make a purchase to inform themselves of and observe all applicable laws and regulations. Unauthorized reproduction or transmission of this material is strictly prohibited. Dimensional accepts no responsibility for loss arising from the use of the information contained herein.
This material is not directed at any person in any jurisdiction where the availability of this material is prohibited or would subject Dimensional or its products or services to any registration, licensing, or other such legal requirements within the jurisdiction.
“Dimensional” refers to the Dimensional separate but affiliated entities generally, rather than to one particular entity. These entities are Dimensional Fund Advisors LP, Dimensional Fund Advisors Ltd., Dimensional Ireland Limited, DFA Australia Limited, Dimensional Fund Advisors Canada ULC, Dimensional Fund Advisors Pte. Ltd., Dimensional Japan Ltd., and Dimensional Hong Kong Limited. Dimensional Hong Kong Limited is licensed by the Securities and Futures Commission to conduct Type 1 (dealing in securities) regulated activities only and does not provide asset management services.
RISKS
Investments involve risks. The investment return and principal value of an investment may fluctuate so that an investor’s shares, when redeemed, may be worth more or less than their original value. Past performance is not a guarantee of future results. There is no guarantee strategies will be successful.
Dimensional Fund Advisors LP is an investment advisor registered with the Securities and Exchange Commission.
Investment products: • Not FDIC Insured • Not Bank Guaranteed • May Lose Value
Dimensional Fund Advisors does not have any bank affiliates
Quarterly Market Summary
RETURNS (USD), AS OF MARCH 31, 2025
| US Stock Market |
International Developed Stocks |
Emerging Markets Stocks |
Global Real Estate |
US Bond Market |
Global Bond Market ex US |
|
|---|---|---|---|---|---|---|
| Q1 2025 | STOCKS | BONDS | ||||
| -4.72% ▼ |
6.20% ▲ |
2.93% ▲ |
1.37% ▲ |
2.78% ▲ |
-0.17% ▼ |
|
| Since January 2001 | ||||||
| Average Quarterly Return |
2.4% | 1.6% | 2.5% | 2.2% | 0.9% | 0.9% |
| Best Quarter |
22.0% 2020 Q2 |
25.9% 2009 Q2 |
34.7% 2009 Q2 |
32.3% 2009 Q3 |
6.8% 2023 Q4 |
5.4% 2023 Q4 |
| Worst Quarter |
-22.8% 2008 Q4 |
-23.3% 2020 Q1 |
-27.6% 2008 Q4 |
-36.1% 2008 Q4 |
-5.9% 2022 Q1 |
-4.1% 2022 Q1 |
Long-Term Market Summary
RETURNS (USD), AS OF MARCH 31, 2025
| US Stock Market |
International Developed Stocks |
Emerging Markets Stocks |
Global Real Estate |
US Bond Market |
Global Bond Market ex US |
|
|---|---|---|---|---|---|---|
| 1 Year | STOCKS | BONDS | ||||
| 7.22% ▲ |
5.30% ▲ |
8.09% ▲ |
5.44% ▲ |
4.88% ▲ |
4.19% ▲ |
|
| 5 Years | ||||||
| 18.18% ▲ |
12.16% ▲ |
7.94% ▲ |
7.89% ▲ |
-0.40% ▼ |
0.87% ▲ |
|
| 10 Years | ||||||
| 11.80% ▲ |
5.50% ▲ |
3.71% ▲ |
2.75% ▲ |
1.46% ▲ |
2.21% ▲ |
|
| 15 Years | ||||||
| 12.76% ▲ |
5.57% ▲ |
3.05% ▲ |
6.03% ▲ |
2.44% ▲ |
3.06% ▲ |
|
| 20 Years | ||||||
| 10.08% ▲ |
5.26% ▲ |
6.06% ▲ |
4.80% ▲ |
3.18% ▲ |
3.47% ▲ |
|
Past performance is not a guarantee of future results. Indices are not available for direct investment. Index performance does not reflect the expenses associated with the management of an actual portfolio.
Market segment (index representation) as follows: US Stock Market (Russell 3000 Index), International Developed Stocks (MSCI World ex USA Index [net dividends]), Emerging Markets (MSCI Emerging Markets Index [net dividends]), Global Real Estate (S&P Global REIT Index [net dividends]), US Bond Market (Bloomberg US Aggregate Bond Index), and Global Bond Market ex US (Bloomberg Global Aggregate ex-USD Bond Index [hedged to USD]). S&P data © 2025 S&P Dow Jones Indices LLC, a division of S&P Global. All rights reserved. Frank Russell Company is the source and owner of the trademarks, service marks, and copyrights related to the Russell Indexes. MSCI data © MSCI 2025, all rights reserved. Bloomberg data provided by Bloomberg.
World Stock Market Performance
MSCI ALL COUNTRY WORLD INDEX WITH SELECTED HEADLINES FROM Q1 2025
1 YEAR (Q2 2024–Q1 2025)
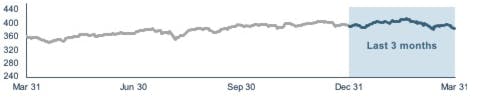
Q1 2025
Graph Source: MSCI ACWI Index (net dividends). MSCI data © MSCI 2025, all rights reserved. Index level based at 100 starting January 2000.
It is not possible to invest directly in an index. Performance does not reflect the expenses associated with management of an actual portfolio. Past performance is not a guarantee of future results.
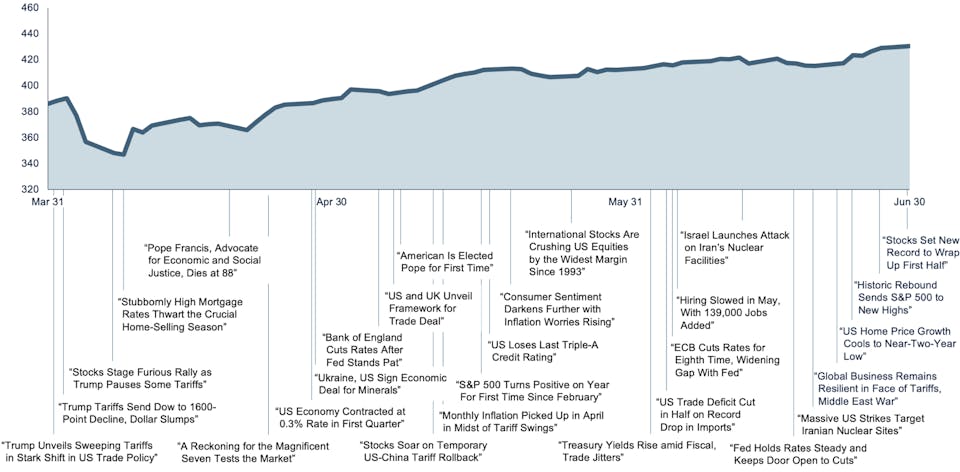
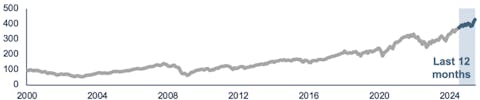
MSCI ALL COUNTRY WORLD INDEX WITH SELECTED HEADLINES FROM PAST 12 MONTHS
Long Term (2000–Q2 2025)
Short Term (Q3 2024–Q2 2025)
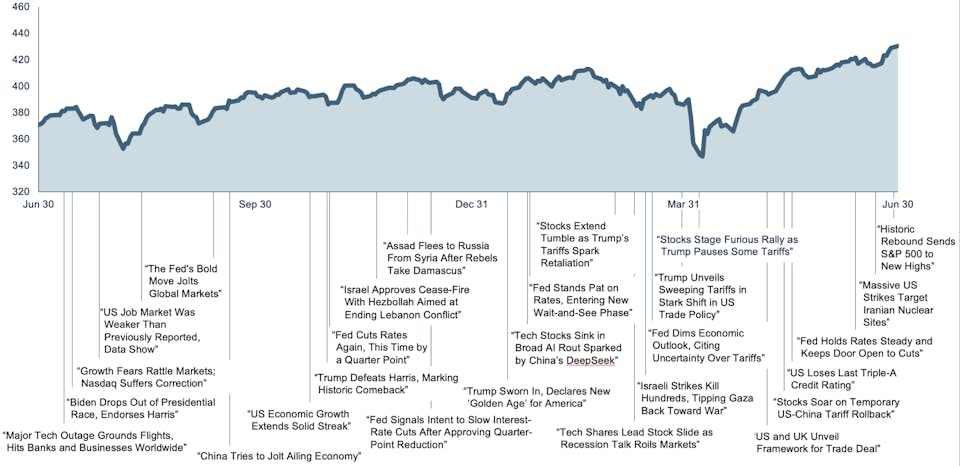
These headlines are not offered to explain market returns. Instead, they serve as a reminder that investors should view daily events from a long-term perspective and avoid making investment decisions based solely on the news.
Graph Source: MSCI ACWI Index (net dividends). MSCI data © MSCI 2024, all rights reserved. Index level based at 100 starting January 2000. It is not possible to invest directly in an index. Performance does not reflect the expenses associated with management of an actual portfolio. Past performance is not a guarantee of future results.
US Stocks
RETURNS (USD), 1ST QUARTER 2025
- The US equity market posted negative returns for the quarter and underperformed both non-US developed and emerging markets.
- Value outperformed growth.
- Small caps underperformed large caps.
- REIT indices outperformed equity market indices.
World Market Capitalization — US
$53.8 trillion
Ranked Returns (%)
Periodic Returns (%)
| Annualized | |||||||
|---|---|---|---|---|---|---|---|
| Asset Class | QTR | 1 Year | 3 Years | 5 Years | 10 Years | 15 Years | 20 Years |
| Large Value | 2.14 | 7.18 | 6.64 | 16.15 | 8.79 | 10.42 | 8.00 |
| Large Cap | -4.49 | 7.82 | 8.65 | 18.47 | 12.18 | 13.02 | 10.24 |
| Marketwide | -4.72 | 7.22 | 8.22 | 18.18 | 11.80 | 12.76 | 10.08 |
| Small Value | -7.74 | -3.12 | 0.05 | 15.31 | 6.07 | 8.19 | 6.80 |
| Small Cap | -9.48 | -4.01 | 0.52 | 13.27 | 6.30 | 8.98 | 7.55 |
| Large Growth | -9.97 | 7.76 | 10.10 | 20.09 | 15.12 | 15.29 | 12.20 |
| Small Growth | -11.12 | -4.86 | 0.78 | 10.78 | 6.14 | 9.51 | 8.06 |
Past performance is not a guarantee of future results. Indices are not available for direct investment. Index performance does not reflect the expenses associated with the management of an actual portfolio. Market segment (index representation) as follows: Marketwide (Russell 3000 Index), Large Cap (Russell 1000 Index), Large Value (Russell 1000 Value Index), Large Growth (Russell 1000 Growth Index), Small Cap (Russell 2000 Index), Small Value (Russell 2000 Value Index), and Small Growth (Russell 2000 Growth Index). World Market Cap represented by Russell 3000 Index, MSCI World ex USA IMI Index, and MSCI Emerging Markets IMI Index. Russell 3000 Index is used as the proxy for the US market. Dow Jones US Select REIT Index used as proxy for the US REIT market. MSCI data © MSCI 2025, all rights reserved. Frank Russell Company is the source and owner of the trademarks, service marks, and copyrights related to the Russell Indexes.
International Developed Stocks
RETURNS (USD), 1ST QUARTER 2025
- Developed markets outside of the US posted positive returns for the quarter and outperformed both US and emerging markets.
- Value outperformed growth.
- Small caps underperformed large caps.
World Market Capitalization
Developed Market
$22.1 trillion
Ranked Returns (%)
Periodic Returns (%)
| Annualized | |||||||
|---|---|---|---|---|---|---|---|
| Asset Class | QTR | 1 Year | 3 Years | 5 Years | 10 Years | 15 Years | 20 Years |
| Value | 10.28 | 12.86 | 8.99 | 15.14 | 5.30 | 5.16 | 4.84 |
| Large Cap | 6.20 | 5.30 | 5.70 | 12.16 | 5.50 | 5.57 | 5.26 |
| Small Cap | 3.40 | 3.58 | 0.81 | 10.71 | 5.42 | 6.15 | 5.64 |
| Growth | 2.09 | -1.82 | 2.31 | 8.91 | 5.42 | 5.78 | 5.52 |
Past performance is not a guarantee of future results. Indices are not available for direct investment. Index performance does not reflect the expenses associated with the management of an actual portfolio. Market segment (index representation) as follows: Large Cap (MSCI World ex USA Index), Small Cap (MSCI World ex USA Small Cap Index), Value (MSCI World ex USA Value Index), and Growth (MSCI World ex USA Growth Index). All index returns are net of withholding tax on dividends. World Market Cap represented by Russell 3000 Index, MSCI World ex USA IMI Index, and MSCI Emerging Markets IMI Index. MSCI World ex USA IMI Index is used as the proxy for the International Developed market. MSCI data © MSCI 2025, all rights reserved. Frank Russell Company is the source and owner of the trademarks, service marks, and copyrights related to the Russell Indexes.
Emerging Markets Stocks
RETURNS (USD), 1ST QUARTER 2025
- Emerging markets posted positive returns for the quarter and outperformed the US market, but underperformed non-US developed markets.
- Value outperformed growth.
- Small caps underperformed large caps.
World Market Capitalization - Emerging Markets
$9.1 trillion
Ranked Returns (%)
Period Returns (%)
| Annualized | |||||||
|---|---|---|---|---|---|---|---|
| Asset Class | QTR | 1 Year | 3 Years | 5 Years | 10 Years | 15 Years | 20 Years |
| Value | 4.32 | 7.60 | 2.76 | 9.81 | 3.21 | 2.17 | 5.79 |
| Large Cap | 2.93 | 8.09 | 1.44 | 7.94 | 3.71 | 3.05 | 6.06 |
| Growth | 1.66 | 8.50 | 0.19 | 6.12 | 4.11 | 3.84 | 6.25 |
| Small Cap | -5.49 | -2.00 | 1.69 | 15.73 | 4.76 | 4.05 | 7.24 |
Past performance is not a guarantee of future results. Indices are not available for direct investment. Index performance does not reflect the expenses associated with the management of an actual portfolio. Market segment (index representation) as follows: Large Cap (MSCI World ex USA Index), Small Cap (MSCI World ex USA Small Cap Index), Value (MSCI World ex USA Value Index), and Growth (MSCI World ex USA Growth Index). All index returns are net of withholding tax on dividends. World Market Cap represented by Russell 3000 Index, MSCI World ex USA IMI Index, and MSCI Emerging Markets IMI Index. MSCI World ex USA IMI Index is used as the proxy for the International Developed market. MSCI data © MSCI 2025, all rights reserved. Frank Russell Company is the source and owner of the trademarks, service marks, and copyrights related to the Russell Indexes.
Country Returns
RETURNS (USD), 1ST QUARTER 2025

Past performance is not a guarantee of future results.
Country returns are the country component indices of the MSCI All Country World IMI Index for all countries except the United States, where the Russell 3000 Index is used instead. Global is the return of the MSCI All Country World IMI Index. MSCI index returns are net dividend. Indices are not available for direct investment. Their performance does not reflect the expenses associated with the management of an actual portfolio. Frank Russell Company is the source and owner of the trademarks, service marks and copyrights related to the Russell Indexes. MSCI data © MSCI 2025, all rights reserved.
Real Estate Investment Trusts (REITs)
RETURNS (USD), 1ST QUARTER 2025
- US real estate investment trusts underperformed non-US REITs during the quarter.
Total Value of REIT Stocks
$1,080 billion 103 REITS
$423 billion 271 REITs (25 other countries)
Ranked Returns (%)
Periodic Returns (%)
| Annualized | |||||||
|---|---|---|---|---|---|---|---|
| Asset Class | QTR | 1 Year | 3 Years | 5 Years | 10 Years | 15 Years | 20 Years |
| Global ex US REITS | 3.44 | -2.27 | -7.04 | 3.20 | 0.18 | 3.47 | 2.47 |
| US REITS | 1.17 | 9.79 | -1.41 | 10.84 | 4.53 | 8.18 | 6.96 |
Past performance is not a guarantee of future results. Indices are not available for direct investment. Index performance does not reflect the expenses associated with the management of an actual portfolio. Number of REIT stocks and total value based on the two indices. All index returns are net of withholding tax on dividends. Total value of REIT stocks represented by Dow Jones US Select REIT Index and the S&P Global ex US REIT Index. Dow Jones US Select REIT Index used as proxy for the US market, and S&P Global ex US REIT Index used as proxy for the World ex US market. Dow Jones and S&P data © 2024 S&P Dow Jones Indices LLC, a division of S&P Global. All rights reserved
Commodities
Returns (USD), 1ST QUARTER 2025
The Bloomberg Commodity Total Return Index returned +8.88% for the first quarter of 2025.
Natural Gas and Copper were the best performers, returning +30.01% and +23.82% during the quarter, respectively. Soybean Meal and Zinc were the worst performers, returning -10.07% and -5.43% during the quarter, respectively.
| Asset Class | Commodities | |
|---|---|---|
| QTR | 8.88 | |
| 1 Year | 12.28 | Annualized |
| 3 Years | -0.77 | |
| 5 Years | 14.51 | |
| 10 Years | 2.77 | |
| 15 Years | -0.14 | |
| 20 Years | -0.44 | |
Ranked Returns (%)
Past performance is not a guarantee of future results. Index is not available for direct investment. Index performance does not reflect the expenses associated with the management of an actual portfolio.
Commodities returns represent the return of the Bloomberg Commodity Total Return Index. Individual commodities are sub-index values of the Bloomberg Commodity Total Return Index. Data provided by Bloomberg.
Fixed Income
RETURNS (USD), 1ST QUARTER 2025
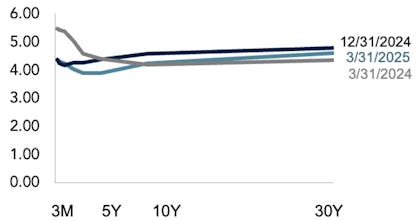
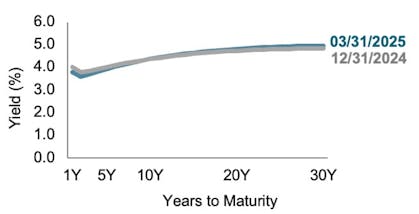
Within the US Treasury market, interest rates generally decreased during the quarter.
On the short end of the yield curve, the 1-Month US Treasury Bill yield decreased 2 basis points (bps) to 4.38%, while the 1-Year US Treasury Bill yield decreased 13 bps to 4.03%. The yield on the 2-Year US Treasury Note decreased 36 bps to 3.89%.
The yield on the 5-Year US Treasury Note decreased 42 bps to 3.96%. The yield on the 10-Year US Treasury Note decreased 35 bps to 4.23%. The yield on the 30-Year US Treasury Bond decreased 19 bps to 4.59%.
In terms of total returns, short-term US treasury bonds returned +2.04% while intermediate-term US treasury bonds returned +2.49%. Short-term corporate bonds returned +1.96% and intermediate-term corporate bonds returned +2.27%.Footnote 1
The total returns for short- and intermediate-term municipal bonds were +1.00% and +0.64%, respectively. Within the municipal fixed income market, general obligation bonds returned -0.29% while revenue bonds returned -0.22%.Footnote 2
US Treasury Yield Curve (%)
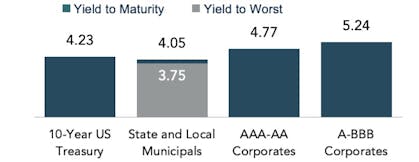
Yield Across Issuers (%)
Periodic Returns (%)
| Annualized | |||||||
|---|---|---|---|---|---|---|---|
| Asset Class | QTR | 1 Year | 3 Years | 5 Years | 10 Years | 15 Years | 20 Years |
| Bloomberg U.S. Government Bond Index Long | 4.67 | 1.28 | -7.17 | -7.83 | -0.54 | 3.01 | 3.56 |
| Bloomberg U.S. TIPS Index | 4.17 | 6.17 | 0.06 | 2.36 | 2.51 | 3.10 | 3.53 |
| Bloomberg U.S. Aggregate Bond Index | 2.78 | 4.88 | 0.52 | -0.40 | 1.46 | 2.44 | 3.18 |
| FTSE World Government Bond Index 1-5 Years | 2.75 | 4.26 | 0.67 | -0.12 | 0.71 | 0.22 | 1.28 |
| FTSE World Government Bond Index 1-5 Years (hedged to USD) | 1.43 | 5.52 | 2.90 | 1.27 | 1.75 | 1.75 | 2.43 |
| ICE BofA 1-Year US Treasury Note Index | 1.05 | 4.98 | 3.42 | 1.88 | 1.73 | 1.28 | 1.86 |
| ICE BofA US 3-Month Treasury Bill Index | 1.02 | 4.97 | 4.23 | 2.56 | 1.87 | 1.27 | 1.68 |
| Bloomberg U.S. High Yield Corporate Bond Index | 1.00 | 7.69 | 4.98 | 7.29 | 5.01 | 6.19 | 6.59 |
| Bloomberg Municipal Bond Index | -0.22 | 1.22 | 1.53 | 1.07 | 2.13 | 3.11 | 3.48 |
- Bloomberg US Treasury and US Corporate Bond Indices. Back to ↩
- Bloomberg Municipal Bond Index. Back to ↩
One basis point (bps) equals 0.01%. Past performance is not a guarantee of future results. Indices are not available for direct investment. Index performance does not reflect the expenses associated with the management of an actual portfolio. Yield curve data from Federal Reserve. State and local bonds and the Yield to Worst are from the S&P National AMT-Free Municipal Bond Index. AAA-AA Corporates represent the ICE BofA US Corporates, AA-AAA rated. A-BBB Corporates represent the ICE BofA Corporates, BBB-A rated. Bloomberg data provided by Bloomberg. US long-term bonds, bills, inflation, and fixed income factor data © Stocks, Bonds, Bills, and Inflation (SBBI) Yearbook™, Ibbotson Associates, Chicago (annually updated work by Roger G. Ibbotson and Rex A. Sinquefield). FTSE fixed income indices © 2025 FTSE Fixed Income LLC, all rights reserved. ICE BofA index data © 2025 ICE Data Indices, LLC. S&P data © 2025 S&P Dow Jones Indices LLC, a division of S&P Global. All rights reserved. Bloomberg data provided by Bloomberg.
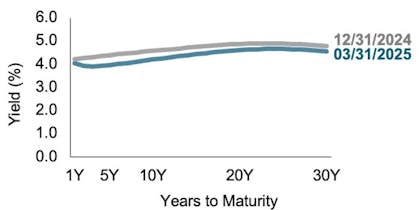
Global Fixed Income
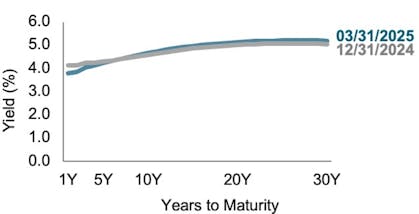
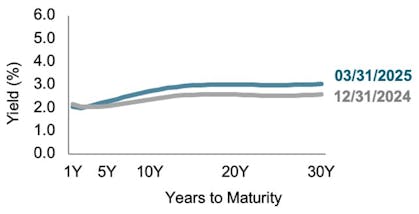
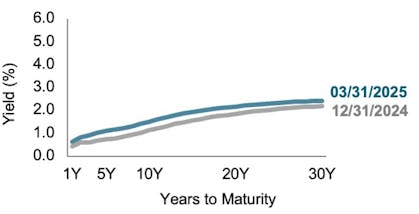
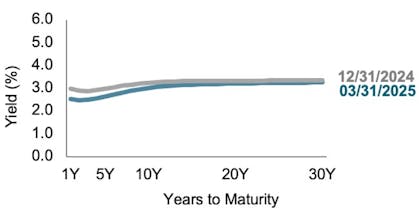
YIELD CURVES, 1ST QUARTER 2025
With the exception of Canada and Japan, interest rates generally decreased in the short- to intermediate-term segment and increased in the longer-term segment across global developed markets for the quarter.
Realized term premiums were generally mixed across global developed markets. With the exception of the US, longer-term bonds generally underperformed shorter-term bonds during the period.
In Canada, interest rates decreased across all maturity segments. In Japan, interest rates increased across all maturity segments. The short-term segment of the yield curve remained inverted in Germany, Canada and Australia. However, the short-term segment of the yield curve in the UK became upwardly sloped.
US
UK
Germany
Japan
Canada
Australia
Changes in Yields (BPS) Since 09/30/2024
| Country | 1Y | 5Y | 10Y | 20Y | 30Y |
|---|---|---|---|---|---|
| US | -16.6 | -43.6 | -36.9 | -26.3 | -22.2 |
| UK | -33.7 | -6.1 | 6.9 | 12.0 | 14.3 |
| Germany | -10.6 | 19.4 | 35.2 | 43.8 | 45.8 |
| Japan | 20.9 | 37.4 | 38.7 | 31.8 | 24.4 |
| Canada | -44.8 | -33.4 | -23.1 | -12.5 | -8.1 |
| Australia | -21.9 | -7.5 | 0.5 | 8.0 | 12.3 |
One basis point (bps) equals 0.01%. Source: ICE BofA government yield. ICE BofA index data © 2025 ICE Data Indices, LLC.
Accessibility Statement
This website is run by R|W Investment Management. We strive to make our website as accessible as possible. If you would like to receive this content in a different way, please contact us toll-free at (844) 834-7500.