Short term Q2 2024 to Q1 2025
TEXT DESCRIPTION
Presentation
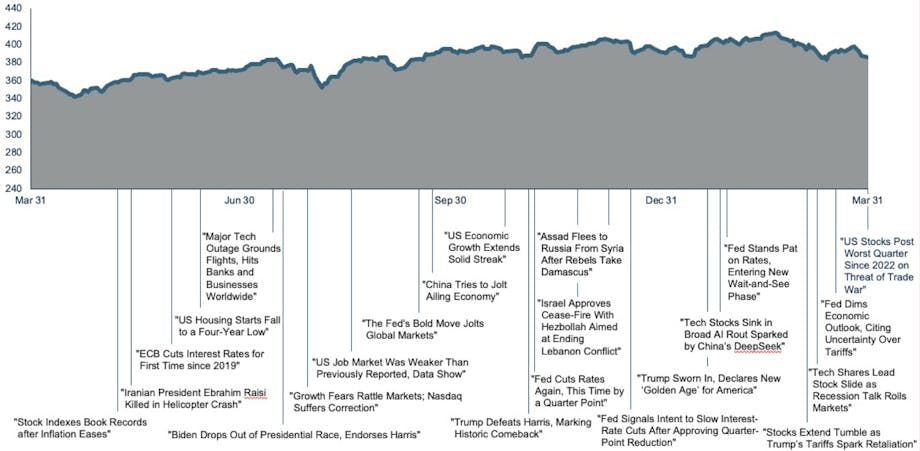
Line chart with MSCI All Country World Index along the Y-axis with a range of 240 to 440, and quarters along the X-axis ranging from March 31, 2024 to March 31, 2025. The chart shows the index increasing about 20 points over the time period and is annotated with newspaper headlines which are described under the Data section.
Data
March 31, 2024
- Stock Indexes Book Records after Inflation Eases
- Iranian President Ebrahim Raisi Killed in Helicopter Crash
- ECB Cuts Interest Rates for First Time Since 2019
- US Housing Starts Fall to a Four-Year Low
June 30, 2024
- Major Tech Outage Grounds Flights, Hits Banks and Businesses Worldwide
- Biden Drops Out of Presidential Race, Endorses Harris
- Growth Fears Rattle Markets; Nasdaq Suffers Correction
- US Job Market Was Weaker Than Previously Reported, Data Show
- The Fed's Bold Move Jolts Global Markets
- China Tries to Jolt Ailing Economy
September 30, 2024
- US Economic Growth Extends Solid Streak
- Trump Defeats Harris, Marking Historic Comeback
- Fed Cuts Rates Again, This Time by a Quarter Point
- Israel Approves Cease-Fire With Hezbollah Aimed at Ending Lebanon Conflict
- Assad Flees to Russia From Syria After Rebels Take Damascus
- Fed Signals Intent to Slow Interest-Rate Cuts After Approving Quarter-Point Reduction
December 31, 2024
- Trump Sworn In, Declares New 'Golden Age' for America
- Tech Stocks Sink in Broad AI Rout Sparked by China's DeepSeek
- Fed Stands Pat on Rates, Entering New Wait-and-See Phase
- Stocks Extend Tumble as Trump's Tariffs Spark Retaliation
- Tech Shares Lead Stock Slide as Recession Talk Roils Markets
- Fed Dims Economic Outlook, Citing Uncertainty Over Tariffs
- US Stocks Post Worst Quarter Since 2022 on Threat of Trade War
Accessibility Statement
This website is run by R|W Investment Management. We strive to make our website as accessible as possible. If you would like to receive this content in a different way, please contact us toll-free at (844) 834-7500.