
This report features world capital market performance and a timeline of events for the past quarter. It begins with a global overview, then features the returns of stock and bond asset classes in the US and international markets.
Table of Contents
RW Investment Management, LLC dba R|W Investment Management ("RWIM") is a Registered Investment Adviser. This document is solely for informational purposes. Advisory services are only offered to clients or prospective clients where RWIM and its representatives are properly licensed or exempt from licensure. Past performance is no guarantee of future returns. Investing involves risk and possible loss of principal capital. No advice may be rendered by RWIM unless a client service agreement is in place. RWIM is not a legal or tax advisor.
Quarterly Topic: AI Is Everywhere, Including Your Portfolio
3rd QUARTER 2025
Wes Crill, PhD, Senior Client Solutions Director and Vice President, Dimensional Fund Advisors
One of the most common investor questions regarding the rise of artificial intelligence (AI) is "How do I take advantage of it in my portfolio?" The good news for investors is diversified equity portfolios already have exposure, mainly because AI tools touch nearly every type of business these days.
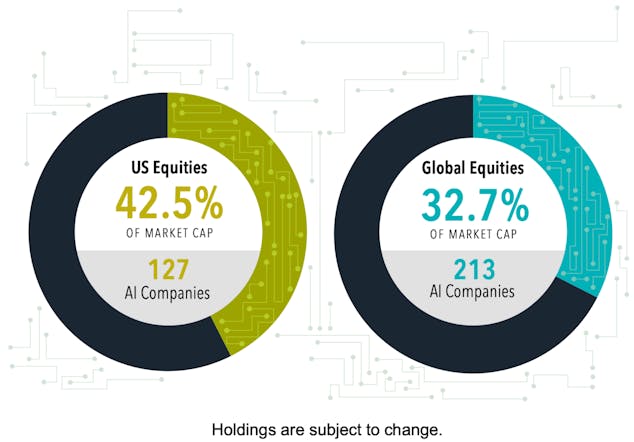
Holdings of the five largest AI ETFs collectively span a sizable chunk of the market—42.5% of US stock market capitalization and 32.7% of global market cap. And it's not just a few big companies like NVIDIA or Apple—in the US alone, 127 companies are included among these AI-focused strategies.
The pervasiveness of AI opportunities is evident when perusing the company names. The usual suspects from technology are well represented—all five hold NVIDIA—but less techy names like Caterpillar, Honeywell, and Thomson Reuters can be found within these ETFs. This exemplifies how AI is likely to touch virtually every business type, making it harder to predict the ultimate winners from the revolution. Broad diversification can help investors avoid missing out on these winners, wherever they show up.
PERCENT OF THE MARKET HELD BY THE TOP 5 AI ETFsAs of December 31, 2024
Past performance is no guarantee of future results.
Source: Dimensional, using Dimensional and Morningstar data. AI companies are represented by the holdings in the top five largest artificial intelligence (AI) ETFs based on assets under management as of December 31, 2024: AIQ, BOTZ, QTUM, ARKQ, and ROBT. Eligible universe includes US domiciled funds in the US Sector Equity and US Equity Morningstar US category groups. Artificial intelligence (AI) funds include those with one or more of the following terms in the fund name: “AI,” “Quantum,” “Intelligent Machines,” “Autonomous,” “Deep Learning,” “Artificial Intelligence,” “Machine Learning.” Fund names including “AI Powered” are excluded from the analysis. Fund list may not be exhaustive of all funds that invest in AI-themed stocks. The sample excludes leveraged funds, funds of funds, and the US Fund Real Estate and US Fund Infrastructure US category groups. Global Equities is represented by the MSCI ACWI IMI Index. US Equities is represented by the Russell 3000 Index. MSCI data © MSCI 2025, all rights reserved. Frank Russell Company is the source and owner of the trademarks, service marks, and copyrights related to the Russell Indexes.
This information should not be considered a recommendation to buy or sell a particular security. Named securities may be held in accounts managed by Dimensional.
Disclosures
The information in this material is intended for the recipient's background information and use only. It is provided in good faith and without any warranty or representation as to accuracy or completeness. Information and opinions presented in this material have been obtained or derived from sources believed by Dimensional to be reliable, and Dimensional has reasonable grounds to believe that all factual information herein is true as at the date of this material. It does not constitute investment advice, a recommendation, or an offer of any services or products for sale and is not intended to provide a sufficient basis on which to make an investment decision. Before acting on any information in this document, you should consider whether it is appropriate for your particular circumstances and, if appropriate, seek professional advice. It is the responsibility of any persons wishing to make a purchase to inform themselves of and observe all applicable laws and regulations. Unauthorized reproduction or transmission of this material is strictly prohibited. Dimensional accepts no responsibility for loss arising from the use of the information contained herein.
This material is not directed at any person in any jurisdiction where the availability of this material is prohibited or would subject Dimensional or its products or services to any registration, licensing, or other such legal requirements within the jurisdiction.
"Dimensional" refers to the Dimensional separate but affiliated entities generally, rather than to one particular entity. These entities are Dimensional Fund Advisors LP, Dimensional Fund Advisors Ltd., Dimensional Ireland Limited, DFA Australia Limited, Dimensional Fund Advisors Canada ULC, Dimensional Fund Advisors Pte. Ltd., Dimensional Japan Ltd., and Dimensional Hong Kong Limited. Dimensional Hong Kong Limited is licensed by the Securities and Futures Commission to conduct Type 1 (dealing in securities) regulated activities only and does not provide asset management services.
RISKS
Investments involve risks. The investment return and principal value of an investment may fluctuate so that an investor's shares, when redeemed, may be worth more or less than their original value. Past performance is not a guarantee of future results. There is no guarantee strategies will be successful.
Dimensional Fund Advisors LP is an investment advisor registered with the Securities and Exchange Commission.
Investment products: • Not FDIC Insured • Not Bank Guaranteed • May Lose Value
Dimensional Fund Advisors does not have any bank affiliates
World Stock Market Performance
MSCI ALL COUNTRY WORLD INDEX WITH SELECTED HEADLINES FROM Q3 2025
1 YEAR (Q4 2024-Q3 2025)
Q3 2025
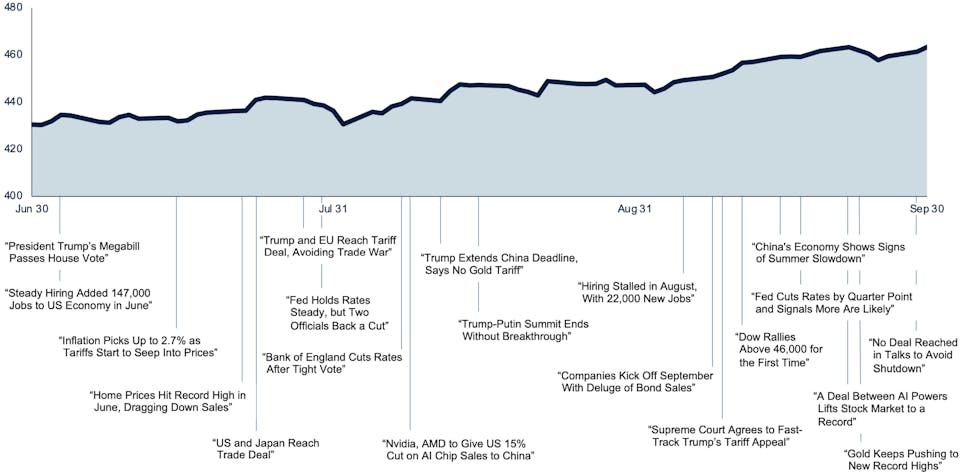
These headlines are not offered to explain market returns. Instead, they serve as a reminder that investors should view daily events from a long-term perspective and avoid making investment decisions based solely on the news.
Graph Source: MSCI ACWI Index (net dividends). MSCI data © MSCI 2025, all rights reserved. Index level based at 100 starting January 2000.
It is not possible to invest directly in an index. Performance does not reflect the expenses associated with management of an actual portfolio. Past performance is not a guarantee of future results.
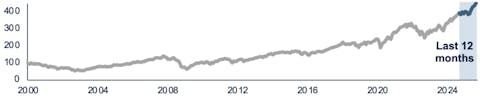
MSCI ALL COUNTRY WORLD INDEX WITH SELECTED HEADLINES FROM PAST 12 MONTHS
Long Term (2000-Q3 2025)
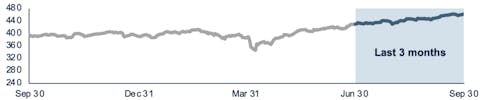
Short Term (Q4 2024-Q3 2025)

These headlines are not offered to explain market returns. Instead, they serve as a reminder that investors should view daily events from a long-term perspective and avoid making investment decisions based solely on the news.
Graph Source: MSCI ACWI Index (net dividends). MSCI data © MSCI 2025, all rights reserved. Index level based at 100 starting January 2000. It is not possible to invest directly in an index. Performance does not reflect the expenses associated with management of an actual portfolio. Past performance is not a guarantee of future results.
US Stocks
RETURNS (USD), 3rd Quarter 2025
- The US equity market posted positive returns for the quarter and outperformed non-US developed markets but underperformed emerging markets.
- Value underperformed growth.
- Small caps outperformed large caps.
- REIT indices underperformed equity market indices.
World Market Capitalization — US
$64.2 trillion
Ranked Returns (%)
Periodic Returns (%)
| Annualized | ||||||||
|---|---|---|---|---|---|---|---|---|
| Asset Class | QTR | YTD | 1 Year | 3 Years | 5 Years | 10 Years | 15 Years | 20 Years |
| Small Value | 12.60 | 9.04 | 7.88 | 13.56 | 14.59 | 9.23 | 9.54 | 7.27 |
| Small Cap | 12.39 | 10.39 | 10.76 | 15.21 | 11.56 | 9.77 | 10.42 | 8.14 |
| Small Growth | 12.19 | 11.65 | 13.56 | 16.68 | 8.41 | 9.91 | 11.01 | 8.78 |
| Large Growth | 10.51 | 17.24 | 25.53 | 31.61 | 17.58 | 18.83 | 17.36 | 13.33 |
| Marketwide | 8.18 | 14.40 | 17.41 | 24.12 | 15.74 | 14.71 | 14.23 | 10.75 |
| Large Cap | 7.99 | 14.60 | 17.75 | 24.64 | 15.99 | 15.04 | 14.49 | 10.92 |
| Large Value | 5.33 | 11.65 | 9.44 | 16.96 | 13.88 | 10.72 | 11.24 | 8.19 |
Past performance is not a guarantee of future results. Indices are not available for direct investment. Index performance does not reflect the expenses associated with the management of an actual portfolio. Market segment (index representation) as follows: Marketwide (Russell 3000 Index), Large Cap (Russell 1000 Index), Large Value (Russell 1000 Value Index), Large Growth (Russell 1000 Growth Index), Small Cap (Russell 2000 Index), Small Value (Russell 2000 Value Index), and Small Growth (Russell 2000 Growth Index). World Market Cap represented by Russell 3000 Index, MSCI World ex USA IMI Index, and MSCI Emerging Markets IMI Index. Russell 3000 Index is used as the proxy for the US market. Dow Jones US Select REIT Index used as proxy for the US REIT market. MSCI data © MSCI 2025, all rights reserved. Frank Russell Company is the source and owner of the trademarks, service marks, and copyrights related to the Russell Indexes.
International Developed Stocks
RETURNS (USD), 3rd Quarter 2025
- Developed markets outside of the US posted positive returns for the quarter and underperformed both US and emerging markets.
- Value outperformed growth.
- Small caps outperformed large caps.
World Market Capitalization
Developed Market
$25.9 trillion
Ranked Returns (%)
Periodic Returns (%)
| Annualized | ||||||||
|---|---|---|---|---|---|---|---|---|
| Asset Class | QTR | YTD | 1 Year | 3 Years | 5 Years | 10 Years | 15 Years | 20 Years |
| Value | 7.88 | 31.51 | 22.90 | 25.20 | 16.20 | 8.54 | 6.52 | 5.28 |
| Small Cap | 7.24 | 29.54 | 19.35 | 19.98 | 9.24 | 8.29 | 7.43 | 6.24 |
| Large Cap | 5.33 | 25.34 | 16.03 | 21.60 | 11.60 | 8.41 | 6.72 | 5.63 |
| Growth | 2.84 | 19.32 | 9.41 | 18.08 | 6.96 | 8.02 | 6.73 | 5.81 |
Past performance is not a guarantee of future results. Indices are not available for direct investment. Index performance does not reflect the expenses associated with the management of an actual portfolio. Market segment (index representation) as follows: Large Cap (MSCI World ex USA Index), Small Cap (MSCI World ex USA Small Cap Index), Value (MSCI World ex USA Value Index), and Growth (MSCI World ex USA Growth Index). All index returns are net of withholding tax on dividends. World Market Cap represented by Russell 3000 Index, MSCI World ex USA IMI Index, and MSCI Emerging Markets IMI Index. MSCI World ex USA IMI Index is used as the proxy for the International Developed market. MSCI data © MSCI 2025, all rights reserved. Frank Russell Company is the source and owner of the trademarks, service marks, and copyrights related to the Russell Indexes.
Emerging Markets Stocks
RETURNS (USD), 3rd Quarter 2025
- Emerging markets posted positive returns for the quarter and outperformed both US and non-US developed markets.
- Value underperformed growth.
- Small caps underperformed large caps.
World Market Capitalization - Emerging Markets
$11.3 trillion
Ranked Returns (%)
Period Returns (%)
| Annualized | ||||||||
|---|---|---|---|---|---|---|---|---|
| Asset Class | QTR | YTD | 1 Year | 3 Years | 5 Years | 10 Years | 15 Years | 20 Years |
| Growth | 12.34 | 30.00 | 21.01 | 18.50 | 4.31 | 8.69 | 4.96 | 6.50 |
| Large Cap | 10.64 | 27.53 | 17.32 | 18.21 | 7.02 | 7.99 | 3.99 | 6.11 |
| Value | 8.74 | 24.79 | 13.30 | 17.81 | 9.90 | 7.14 | 2.90 | 5.62 |
| Small Cap | 5.36 | 16.67 | 8.28 | 17.91 | 12.51 | 8.48 | 4.72 | 7.60 |
Past performance is not a guarantee of future results. Indices are not available for direct investment. Index performance does not reflect the expenses associated with the management of an actual portfolio. Market segment (index representation) as follows: Large Cap (MSCI Emerging Markets Index), Small Cap (MSCI Emerging Markets Small Cap Index), Value (MSCI Emerging Markets Value Index), and Growth (MSCI Emerging Markets Growth Index). All index returns are net of withholding tax on dividends. World Market Cap represented by Russell 3000 Index, MSCI World ex USA IMI Index, and MSCI Emerging Markets IMI Index. MSCI data © MSCI 2025, all rights reserved. Frank Russell Company is the source and owner of the trademarks, service marks, and copyrights related to the Russell Indexes.
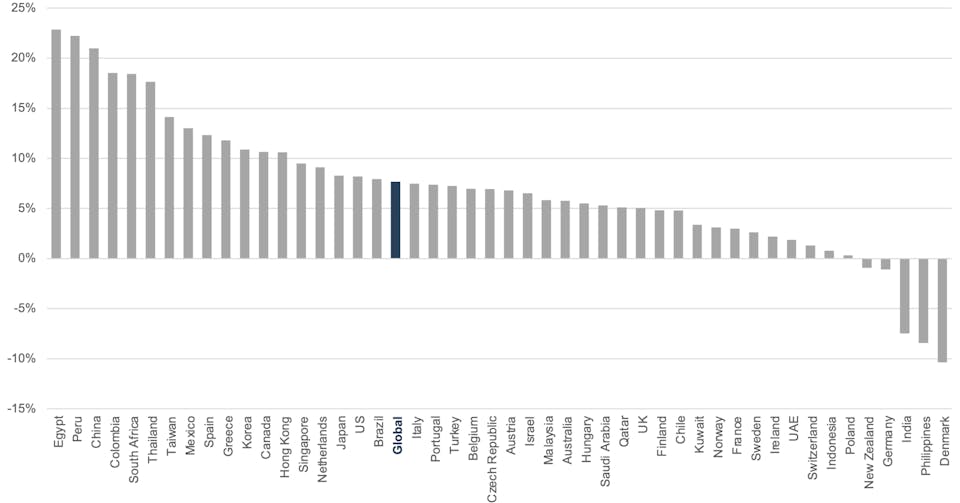
Country Returns
RETURNS (USD), 3rd Quarter 2025
Past performance is not a guarantee of future results.
Country returns are the country component indices of the MSCI All Country World IMI Index for all countries except the United States, where the Russell 3000 Index is used instead. Global is the return of the MSCI All Country World IMI Index. MSCI index returns are net dividend. Indices are not available for direct investment. Their performance does not reflect the expenses associated with the management of an actual portfolio. Frank Russell Company is the source and owner of the trademarks, service marks and copyrights related to the Russell Indexes. MSCI data © MSCI 2025, all rights reserved.
Real Estate Investment Trusts (REITs)
RETURNS (USD), 3rd Quarter 2025
- US real estate investment trusts outperformed non-US REITs during the quarter.
Total Value of REIT Stocks
$1,081 billion
102 REITS
$498 billion
274 REITs
(25 other countries)
Ranked Returns (%)
Periodic Returns (%)
| Annualized | ||||||||
|---|---|---|---|---|---|---|---|---|
| Asset Class | QTR | YTD | 1 Year | 3 Years | 5 Years | 10 Years | 15 Years | 20 Years |
| US REITS | 5.09 | 4.50 | -1.70 | 10.48 | 9.45 | 5.65 | 7.83 | 6.17 |
| Global ex US REITS | 3.62 | 22.42 | 3.61 | 9.89 | 3.65 | 2.65 | 3.97 | 2.88 |
Past performance is not a guarantee of future results. Indices are not available for direct investment. Index performance does not reflect the expenses associated with the management of an actual portfolio. Number of REIT stocks and total value based on the two indices. All index returns are net of withholding tax on dividends. Total value of REIT stocks represented by Dow Jones US Select REIT Index and the S&P Global ex US REIT Index. Dow Jones US Select REIT Index used as proxy for the US market, and S&P Global ex US REIT Index used as proxy for the World ex US market. Dow Jones and S&P data © 2025 S&P Dow Jones Indices LLC, a division of S&P Global. All rights reserved.
Commodities
Returns (USD), 3rd Quarter 2025
The Bloomberg Commodity Total Return Index returned +3.65% for the third quarter of 2025.
Coffee and Silver were the best performers, returning +27.69% and +27.28% during the quarter, respectively. Natural Gas and Wheat were the worst performers, returning -19.03% and -9.30% during the quarter, respectively.
| Asset Class | Commodities | |
|---|---|---|
| QTR | 3.65 | |
| YTD | 9.38 | |
| 1 Year | 8.88 | Annualized |
| 3 Years | 2.76 | |
| 5 Years | 11.53 | |
| 10 Years | 3.96 | |
| 15 Years | -0.51 | |
| 20 Years | -0.97 | |
Ranked Returns (%)
Past performance is not a guarantee of future results. Index is not available for direct investment. Index performance does not reflect the expenses associated with the management of an actual portfolio.
Commodities returns represent the return of the Bloomberg Commodity Total Return Index. Individual commodities are sub-index values of the Bloomberg Commodity Total Return Index. Data provided by Bloomberg.
Fixed Income
RETURNS (USD), 3rd Quarter 2025
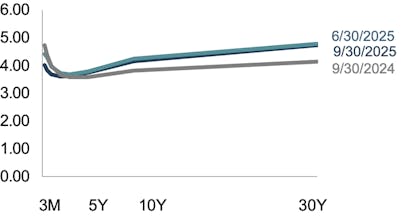
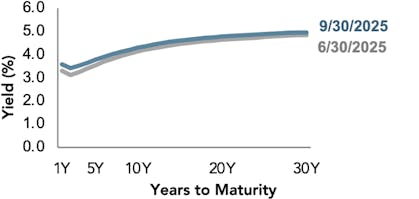
During the quarter, interest rates decreased within the US Treasury market.
On the short end of the yield curve, the 1-Month US Treasury Bill yield decreased 8 basis points to 4.20%, while the 1-Year US Treasury Bill yield decreased 28 basis points to 3.68%. The yield on the 2-Year US Treasury Note decreased 12 basis points to 3.60%.
The yield on the 5-Year US Treasury Note decreased 5 basis points to 3.74%. The yield on the 10-Year US Treasury Note decreased 8 basis points to 4.16%. The yield on the 30-Year US Treasury Bond decreased 5 basis points to 4.73%.
In terms of total returns, short-term US treasury bonds returned +1.17% while intermediate-term US treasury bonds returned +1.26%. Short-term corporate bonds returned +1.62% and intermediate-term corporate bonds returned +2.04%.Footnote 1
The total returns for short- and intermediate-term municipal bonds were +1.53% and +2.77%, respectively. Within the municipal fixed income market, general obligation bonds returned +2.96% while revenue bonds returned +3.03%.Footnote 2
US Treasury Yield Curve (%)
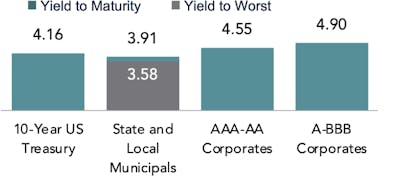
Yield Across Issuers (%)
Periodic Returns (%)
| Annualized | ||||||||
|---|---|---|---|---|---|---|---|---|
| Asset Class | QTR | YTD | 1 Year | 3 Years | 5 Years | 10 Years | 15 Years | 20 Years |
| Bloomberg Municipal Bond Index | 3.00 | 2.64 | 1.39 | 4.74 | 0.86 | 2.34 | 2.94 | 3.48 |
| Bloomberg U.S. High Yield Corporate Bond Index | 2.54 | 7.22 | 7.41 | 11.09 | 5.55 | 6.17 | 6.16 | 6.71 |
| Bloomberg U.S. Government Bond Index Long | 2.49 | 5.65 | -3.44 | 0.46 | -7.73 | -0.09 | 1.96 | 3.36 |
| Bloomberg U.S. TIPS Index | 2.10 | 6.87 | 3.79 | 4.88 | 1.42 | 3.01 | 2.85 | 3.51 |
| Bloomberg U.S. Aggregate Bond Index | 2.03 | 6.13 | 2.88 | 4.93 | -0.45 | 1.84 | 2.26 | 3.23 |
| ICE BofA 1-Year US Treasury Note Index | 1.14 | 3.13 | 3.85 | 4.46 | 2.28 | 1.91 | 1.38 | 1.90 |
| ICE BofA US 3-Month Treasury Bill Index | 1.08 | 3.17 | 4.38 | 4.77 | 2.98 | 2.08 | 1.41 | 1.71 |
| FTSE World Government Bond Index 1-5 Years (hedged to USD) | 1.01 | 4.01 | 4.17 | 4.72 | 1.62 | 1.96 | 1.81 | 2.47 |
| FTSE World Government Bond Index 1-5 Years | 0.63 | 7.71 | 4.07 | 5.47 | 0.14 | 1.07 | 0.19 | 1.71 |
- Bloomberg US Treasury and US Corporate Bond Indices. Back to ↩
- Bloomberg Municipal Bond Index. Back to ↩
One basis point (bps) equals 0.01%. Past performance is not a guarantee of future results. Indices are not available for direct investment. Index performance does not reflect the expenses associated with the management of an actual portfolio. Yield curve data from Federal Reserve. State and local bonds and the Yield to Worst are from the S&P National AMT-Free Municipal Bond Index. AAA-AA Corporates represent the ICE BofA US Corporates, AA-AAA rated. A-BBB Corporates represent the ICE BofA Corporates, BBB-A rated. Bloomberg data provided by Bloomberg. US long-term bonds, bills, inflation, and fixed income factor data © Stocks, Bonds, Bills, and Inflation (SBBI) Yearbook™, Ibbotson Associates, Chicago (annually updated work by Roger G. Ibbotson and Rex A. Sinquefield). FTSE fixed income indices © 2025 FTSE Fixed Income LLC, all rights reserved. ICE BofA index data © 2025 ICE Data Indices, LLC. S&P data © 2025 S&P Dow Jones Indices LLC, a division of S&P Global. All rights reserved. Bloomberg data provided by Bloomberg.
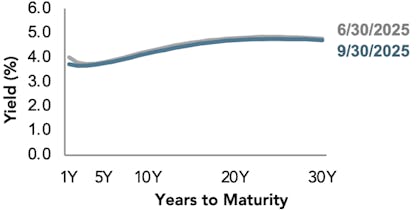
Global Fixed Income
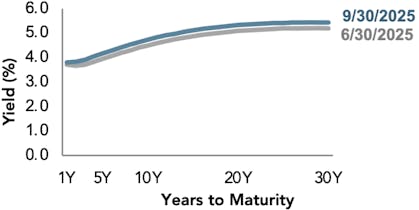
YIELD CURVES, 3rd Quarter 2025
Except for the US and Canada, interest rates increased in the global developed markets for the quarter.
In Canada, short- to intermediate-term interest rates decreased, and long-term interest rates increased. The short-term maturity segment of the yield curve was generally flat but steepened in the three- to five-year maturity segment in Canada, Germany, UK and Australia.
Realized term premiums were mixed across global developed markets. Realized term premiums were positive in the US and Canada, as longer-term bonds generally outperformed shorter-term bonds during the quarter. However, realized term premiums were negative in the UK and Germany, as longer-term bonds generally underperformed shorter-term bonds during the quarter.
US
UK
Germany
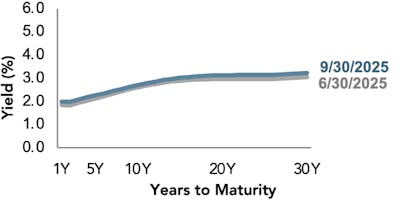
Japan
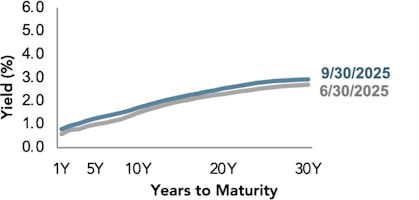
Canada
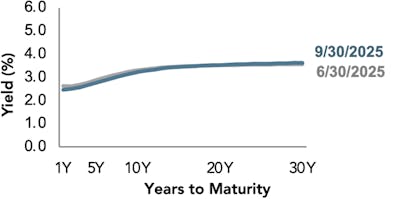
Australia
Changes in Yields (BPS) Since 06/30/2025
| Country | 1Y | 5Y | 10Y | 20Y | 30Y |
|---|---|---|---|---|---|
| US | -28.4 | -4.7 | -8.6 | -9.0 | -5.7 |
| UK | 9.3 | 22.5 | 23.5 | 23.6 | 23.6 |
| Germany | 14.1 | 13.2 | 9.3 | 16.9 | 17.9 |
| Japan | 21.3 | 26.2 | 22.4 | 22.7 | 22.7 |
| Canada | -15.4 | -11.2 | -8.0 | 1.8 | 5.6 |
| Australia | 27.1 | 22.8 | 16.1 | 14.2 | 11.3 |
One basis point (bps) equals 0.01%. Source: ICE BofA government yield. ICE BofA index data © 2025 ICE Data Indices, LLC.
Quarterly Market Summary
Returns (USD), as of September 30, 2025
| US Stock Market |
International Developed Stocks |
Emerging Markets Stocks |
Global Real Estate |
US Bond Market |
Global Bond Market ex US |
|
|---|---|---|---|---|---|---|
| Q3 2025 | STOCKS | BONDS | ||||
| 8.18% ▲ |
5.33% ▲ |
10.64% ▲ |
4.22% ▲ |
2.03% ▲ |
0.49% ▲ |
|
| Since January 2001 | ||||||
| Average Quarterly Return |
2.5% | 1.8% | 2.7% | 2.2% | 1.0% | 0.9% |
| Best Quarter |
22.0% 2020 Q2 |
25.9% 2009 Q2 |
34.7% 2009 Q2 |
32.3% 2009 Q3 |
6.8% 2023 Q4 |
5.4% 2023 Q4 |
| Worst Quarter |
-22.8% 2008 Q4 |
-23.3% 2020 Q1 |
-27.6% 2008 Q4 |
-36.1% 2008 Q4 |
-5.9% 2022 Q1 |
-4.1% 2022 Q1 |
Long-Term Market Summary
Returns (USD), as of September 30, 2025
| US Stock Market |
International Developed Stocks |
Emerging Markets Stocks |
Global Real Estate |
US Bond Market |
Global Bond Market ex US |
|
|---|---|---|---|---|---|---|
| Annualized Returns | STOCKS | BONDS | ||||
| 1 Year | 17.41% ▲ |
16.03% ▲ |
17.32% ▲ |
-1.24% ▼ |
2.88% ▲ |
3.02% ▲ |
| 5 Years | 15.74% ▲ |
11.60% ▲ |
7.02% ▲ |
6.58% ▲ |
-0.45% ▼ |
0.87% ▲ |
| 10 Years | 14.71% ▲ |
8.41% ▲ |
7.99% ▲ |
4.37% ▲ |
1.84% ▲ |
2.58% ▲ |
| 15 Years | 14.23% ▲ |
6.72% ▲ |
3.99% ▲ |
5.91% ▲ |
2.26% ▲ |
2.99% ▲ |
| 20 Years | 10.75% ▲ |
5.63% ▲ |
6.11% ▲ |
4.40% ▲ |
3.23% ▲ |
3.42% ▲ |
Past performance is not a guarantee of future results. Indices are not available for direct investment. Index performance does not reflect the expenses associated with the management of an actual portfolio.
Market segment (index representation) as follows: US Stock Market (Russell 3000 Index), International Developed Stocks (MSCI World ex USA Index [net dividends]), Emerging Markets (MSCI Emerging Markets Index [net dividends]), Global Real Estate (S&P Global REIT Index [net dividends]), US Bond Market (Bloomberg US Aggregate Bond Index), and Global Bond Market ex US (Bloomberg Global Aggregate ex-USD Bond Index [hedged to USD]). S&P data © 2025 S&P Dow Jones Indices LLC, a division of S&P Global. All rights reserved. Frank Russell Company is the source and owner of the trademarks, service marks, and copyrights related to the Russell Indexes. MSCI data © MSCI 2025, all rights reserved. Bloomberg data provided by Bloomberg.
Accessibility Statement
This website is run by R|W Investment Management. We strive to make our website as accessible as possible. If you would like to receive this content in a different way, please contact us toll-free at (844) 834-7500.